

Visualize a Segment
When a segment query is executed the Visualize Segment option is enabled to visualize the data.
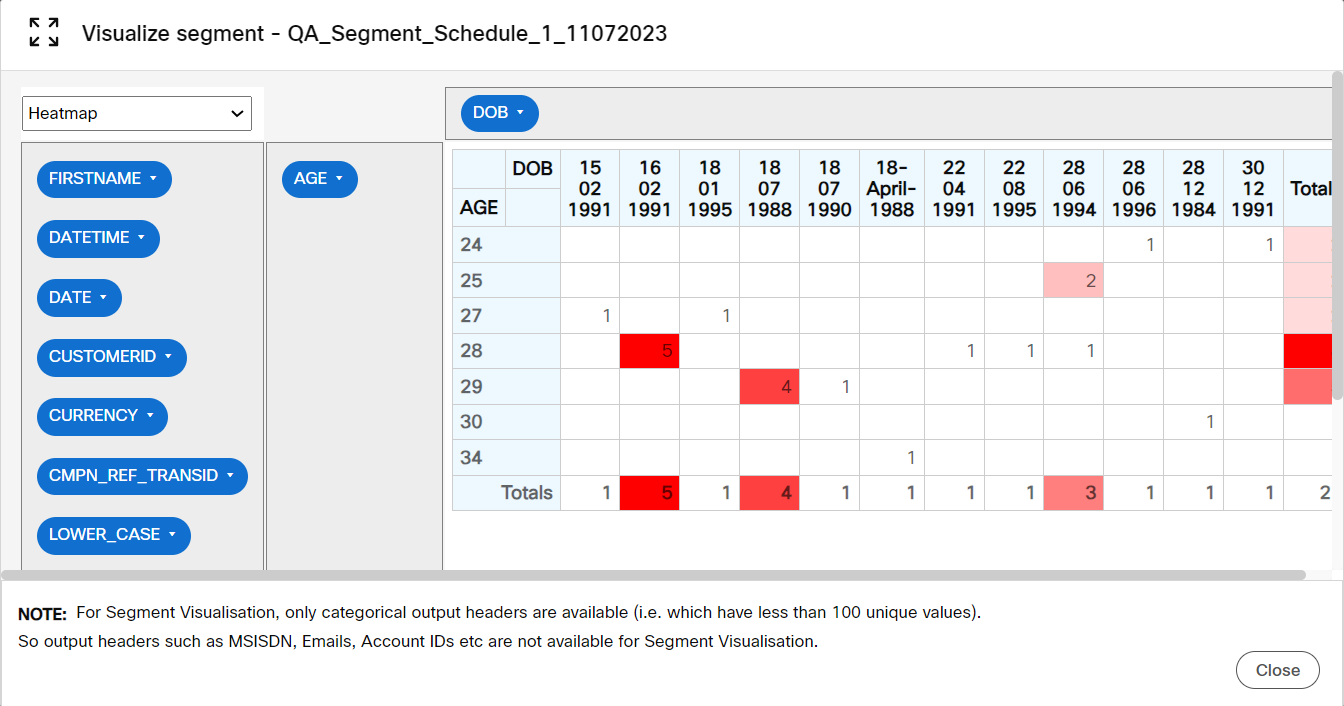
For Segment Visualization, only categorical output headers are available (i.e. which have less than 100 unique values ). So output headers such as MSISDN, Emails, Account IDs, etc are not available for Segment Visualization.
To visualize the data, follow these steps:
- On the Segments list screen, click on the ellipses icon of the required segment.
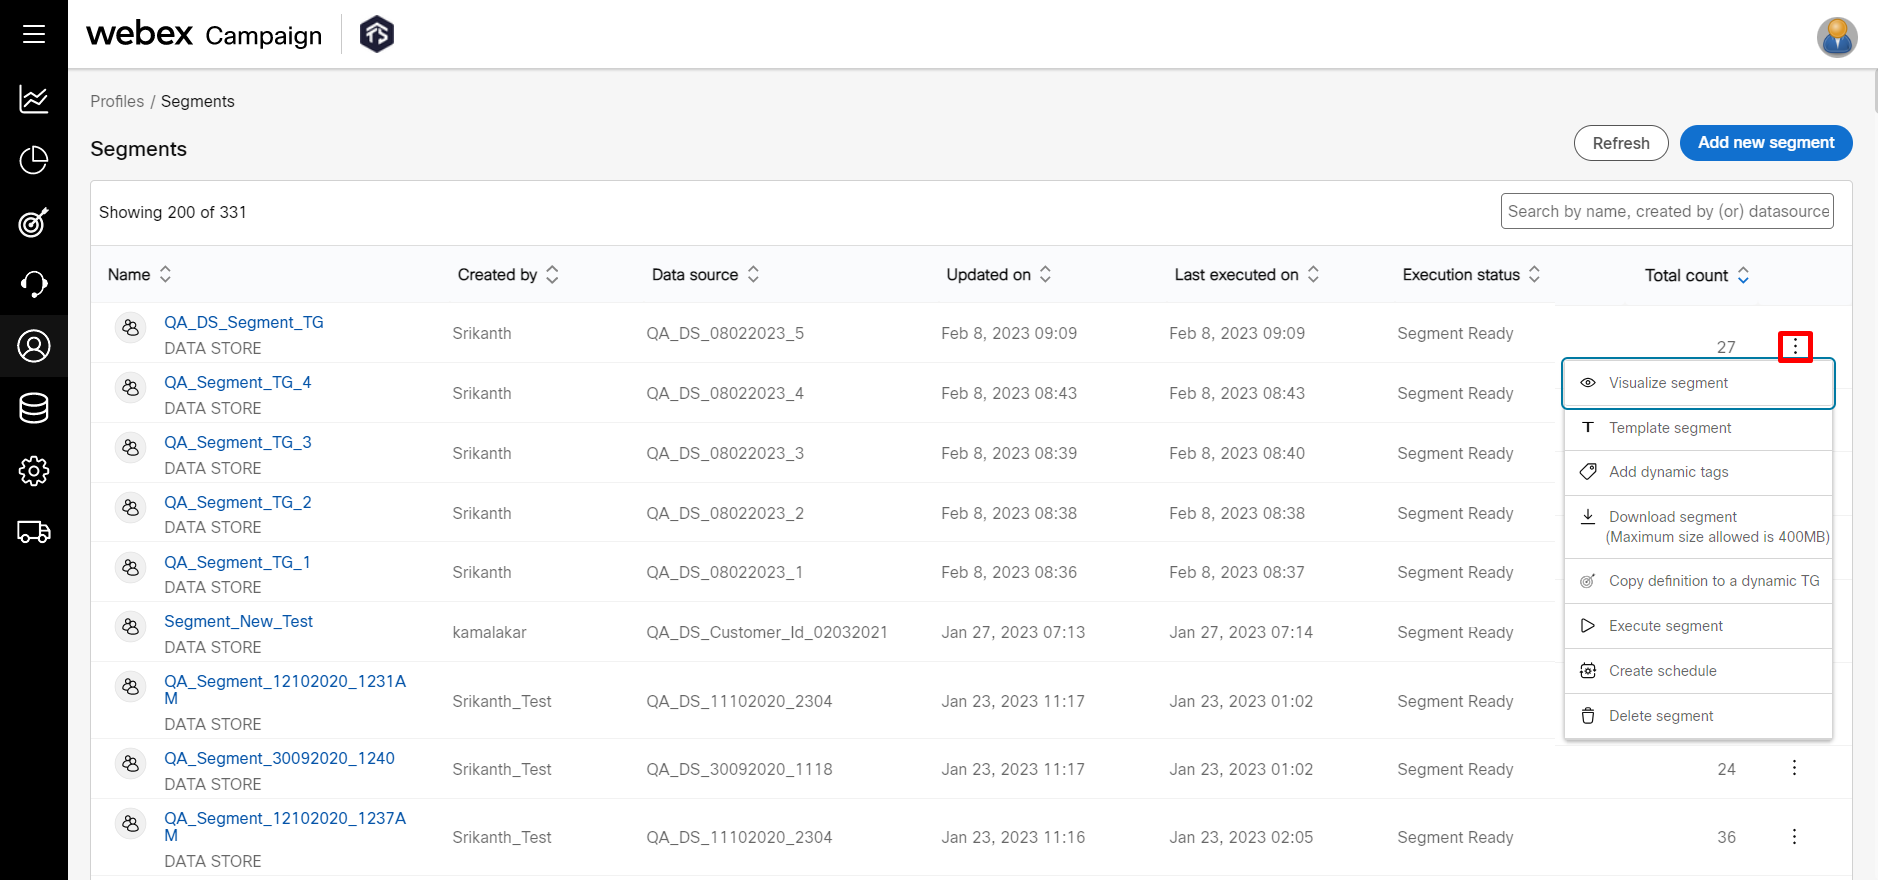
- Click on Visualize segment. The Data Explorer view appears. You can analyze the data of the executed query and take appropriate action during the campaign creation.
- On the segment visualize screen, select the Table option from the drop-down. The headers of the table are displayed. Drag and drop the required columns on the columns and rows panel.
Updated over 1 year ago