

Campaign Details
In this screen, you will be able to view the Customer Engagement metrics side-by-side next to the Outbound Delivery metrics. This makes it much easier to assess the performance of campaigns. There are separate tabs for each channel. For each channel, there are further tabs for Promotions and Instant Deployments.
The date filter values selected at the top of the page will be applicable for all the cards within this page. By default, this screen displays the data in the graphical view. To switch to the tabular view of the graph, click on the Table button.
The graph displays the channel-specific metrics of the selected campaigns. You can apply filters to drill down the deployments based on channels, date, delivered volume, and so on.
The graph shown below is an interactive graph. Click on a specific metric on the graph to turn OFF/ON.

This screen also displays the list of campaigns and deployments. Click the triangle button to view the list of deployments under a specific campaign.

Below is a sample of the table view of a graph.
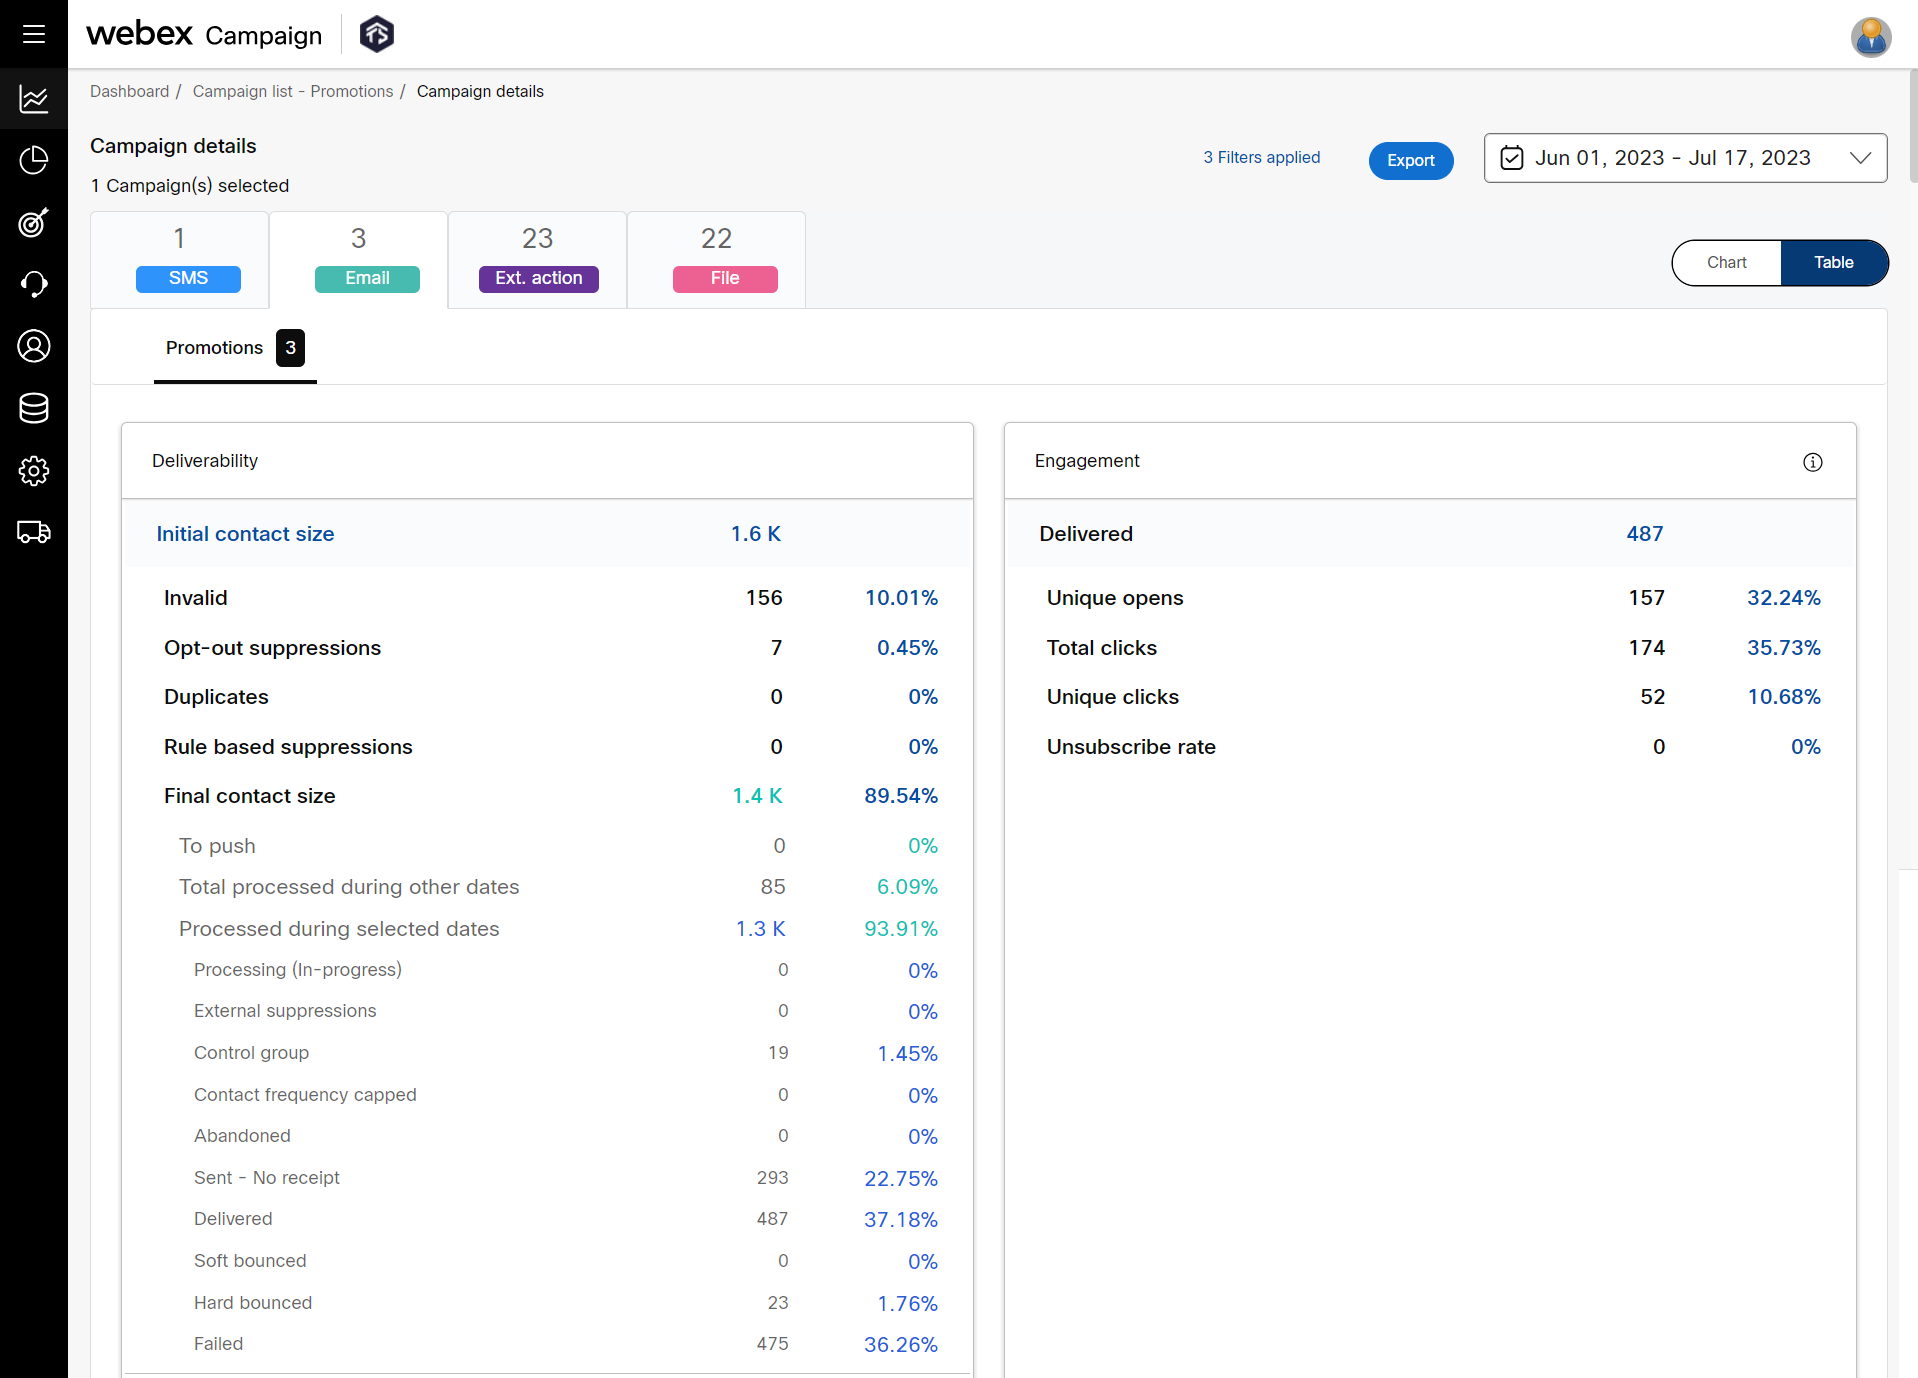
The details in the engagement graph will vary based on the channel selected.
Exporting the campaign details of a P&L group
You can export the campaign details to a PDF or Excel format.
To export the campaign details:
- Click Export on the Campaign Details view.
- Select the Campaign Details or Customer Responses / Click Details from the drop-down list.
- Select the Format to Export from the drop-down list.
- (Optional) To export the entire page, select Export the entire page as PDF.
- Click Export.

Updated over 1 year ago