
Dashboard Deliverability and Engagement metrics for App Push
You can view Deliverability and Engagement statistics for App Push deployments.
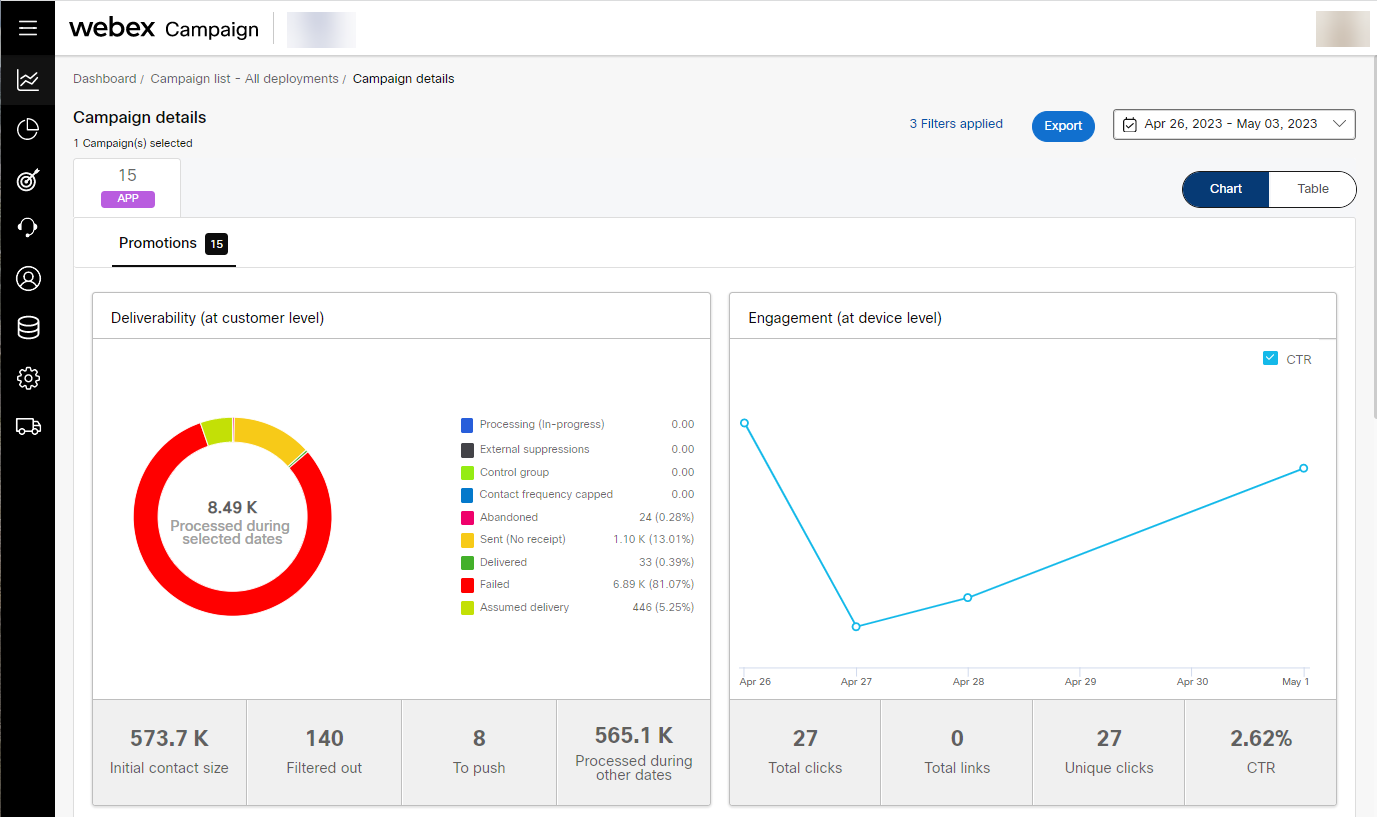
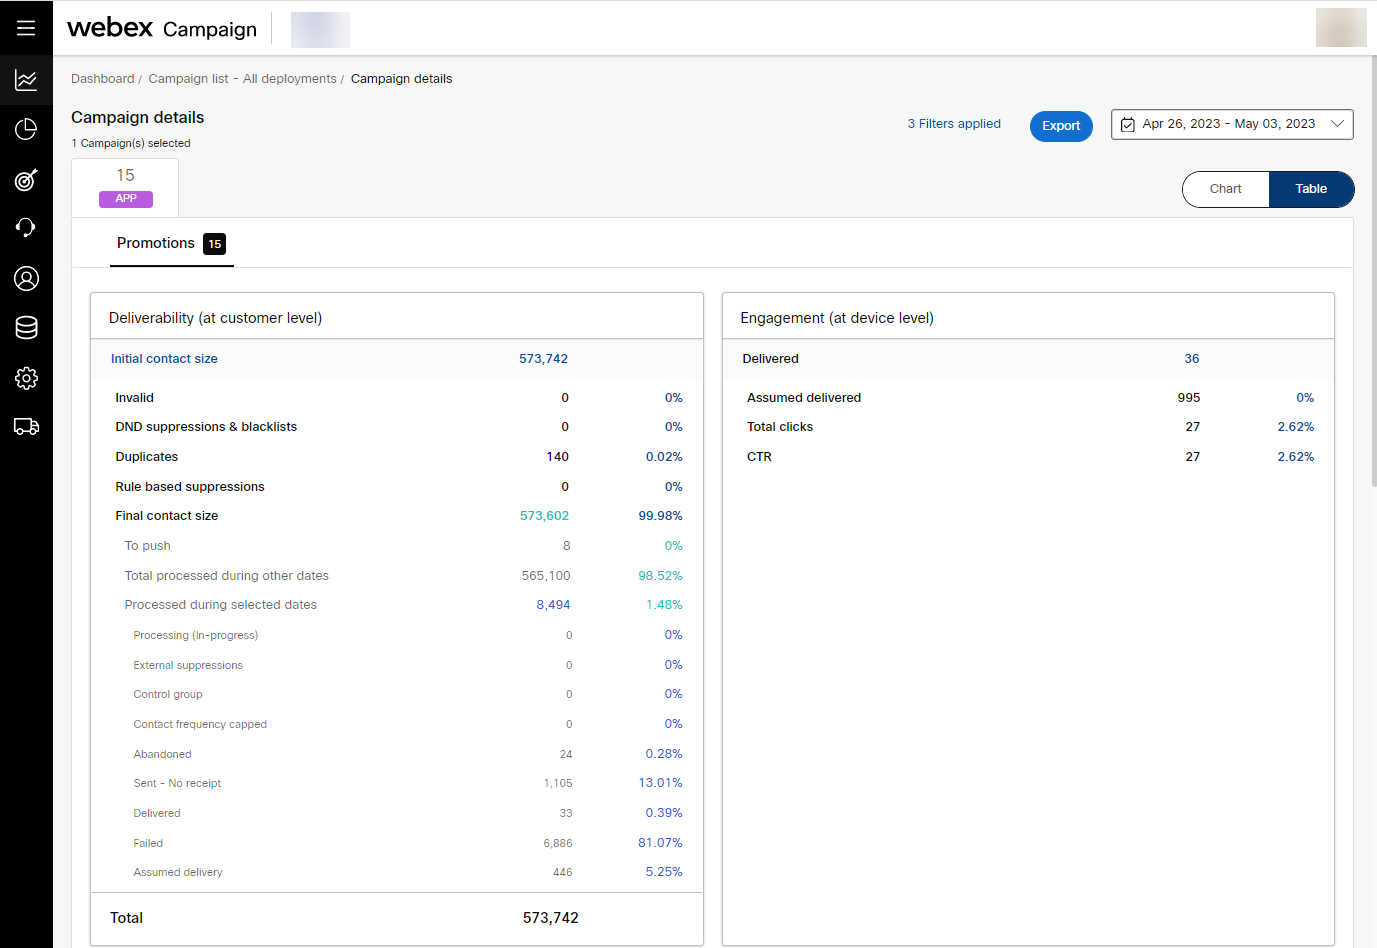
The Chart view will display the high level metrics of the delivery status, while the Table view will show a count of all the delivery statuses. The Deliverability metrics card will display the initial contact size and the count of excluded contacts due to various exclusions. These metrics are displayed at the customer level, representing the number of contacts to whom the message was sent. The Engagement card will display the Click-Through Rate (CTR) metrics for the link clicks on the devices.
The calculation for CTR (Click Through Rate) for App Push is as follows:
App push CTR = (Total clicks/(Delivered on all devices + Assumed delivery on all devices)) * 100
Additionally, you can filter the data based on your preferred deployments. The graph will show two cards: The "All devices" card will present the delivery metrics for the chosen period, while the "OS Breakdown" card will demonstrate the deliverability metrics based on the operating system for iOS and Android platforms.

App push targeting at customer level:
To send App Push messages to a specific customers, you must use unique customer ID values from the Target Group (TG) associated with an App push deployment. Some customers may have installed your app on multiple devices. In such cases, once the deployment is activated, the app push message will be delivered to all instances of the app that are associated with those multiple devices for that particular customer.
When you target a Push message at the customer level, you're targeting the customer and not a specific device where your app is installed. For instance, if your Target Group (TG) has 100 customer records, and out of those 100, 20 customers have installed your app on both their mobile phones and iPad tablets, your app push deployment will deliver the message to all 120 devices associated with those 20 customers.
When you view the Deliverability left-side panel on the Dashboard, the "Delivered" count will be shown as "100," as this count is tracked at the customer level. On the other hand, when you view the Engagement right-side panel, the "Delivered" count will be shown as "120," as this count is tracked at the device level. This is because the push message has been delivered to all instances of the app on each of the 120 devices associated with the 20 customers who have installed the app on multiple devices.
App push targeting at device level:
To send App Push messages to a specific devices, you must use the ‘App-device-ID’ values from the Target Group (TG) associated with an App push deployment. These values are long (over 100 chars alphanumeric) unique IDs assigned by Apple iOS or Google Android when your app is installed on a device. In this case, when the deployment is activated, the app push message will be delivered only to the specific app instances on the specific devices whose ‘App-device-ID’ was listed in your TG file.
When you use the "App-device-ID" values in the Target Group (TG) associated with an App push deployment, you're targeting the specific instance of the app installed on a specific device and not the customer. For example, if your TG has 100 "App-device-ID" values, this may correspond to 85 customers, as 15 out of those 100 "App-device-ID" values may be associated with apps that were installed by 15 customers on their respective second devices.
When you view the Deliverability left-side panel on the Dashboard, the "Delivered" count will be shown as "85," as this count is tracked at the customer level. On the other hand, when you view the Engagement right-side panel, the "Delivered" count will be shown as "100," as this count is tracked at the device level. This is because the push message has been delivered to all 100 instances of the app on the 100 devices associated with the 85 customers in your Target Group.
Assumed Delivery
On the left-side ''Deliverability' table, the 'Assumed delivery' count will show the count of contacts for whom the 'Delivery receipt' (DR) was not received, but for whom it is reasonable to assume that the message was actually delivered correctly.
On the right-side 'Engagement' table, the 'Assumed delivery' count will show the count of devices for whom the 'Delivery receipt' (DR) was not received, but for whom it is reasonable to assume that the message was actually delivered correctly.
The major reason why DRs may not be received in case of app push deployments is because of the way the Apple iOS operating system processes app push notifications. If your app is not open on a device when the push notification is received, then iOS will still show the push notification to the customer, but iOS will not inform your app about this notification. So the SDK embedded within the app will not know about the incoming app push notification; hence the DR will not be received by Webex Campaign in this case. This is why we introduced the 'Assumed delivery' metric specifically for App push channel deployments in release 4.9.6 in Sept 2018.
The Deliverability table will display various count based on the contacts. However, on the Engagement table, the CTR (Click Through Rate) will display count and percentage based on the device level. Hence the App Push CTR do not match with the count displayed on Deliverability table.
For information on each row of the deliverability metrics, click Details of Deliverability Metrics.

Deployment timeline chart view: app push counts by device-apps
This card will display the vertical column chart that allows for easy comparison between messages that were processed during for the selected period, delivered, assumed delivery, link clicks, and failed.

Deployment timeline table view: App push counts by device-apps
This card will display the 2 tables, The All devices table will display the overall delivery metrics and its corresponding percentage value for the selected period. Meanwhile, the "OS breakdown" card will display the deliverability metrics according to the operating system for both iOS and Android platforms, including their respective percentage values.

Updated 11 months ago